- พฤษภาคม 15, 2568
- 0 Comments
สร้างเส้นเกลียวไล่ระดับ ใน Adobe Illustrator EP - 36

ในบทช่วยสอนนี้ เป็นงานต่อเนื่องจากบทช่วยสอนก่อนหน้านี้ คราวนี้จาก Effect เราจะให้หมุนวนออกมา ในคราวก่อนๆ เราจะให้หมุนวนเข้าไปในรูปทรง เราสร้างเส้นเกลียวหมุนวนได้หลากหลายและอย่างง่ายในโปรแกรม Adobe Illustrator ด้วยเครื่องมือและวิธีที่ง่าย ที่คุณสามารถดูและทำตามได้ทุกขั้นตอน
ทักษะ
- การใช้ไอเดีย สร้างงานศิลปะจากรูปทรงเรขาคณิตพื้นฐาน- การใช้ Elipse Tool
- การใช้ Effect - Distort and Transform - Transform
พร้อมแล้วรึยัง เราไปวาดกัน
วิธีสร้างเส้นเกลียวไล่ระดับ
1. ใช้เครื่องมือ Elipse Tool สร้างวงกลมขึ้นมา2. ขนาดประมาณ 20 x 20 px เติมสี (Fill) แบบ Gradient ลงในวงกลม
3. ไปที่แถบเครื่องมือ Effect - Distort and Transform - Transform จะมีกล่องเครื่องมือ Transform Effect โผล่ออกมา
. เริ่มแรกนี้อยากให้ลองปรับค่าตามเราไปก่อน จนเป็นแล้วค่อยปรับตามที่ตัวเองชอบ
- ปรับค่า Scale ไปที่ 102% ทั้งค่าแนวตั้ง และแนวนอน
- ปรับค่า Copies ไปที่ 155
- ปรับค่า Rotate ไปที่ 4 องศา หรือตามที่ตัวเองชอบ
7. เมื่อได้แบบที่พอใจแล้ว กดปุ่ม OK
งานสร้างเส้นเกลียวไล่ระดับสี เสร็จแล้ว!!
สามารถเข้าไปดูวิธีการและกดติดตามช่อง Youtube ได้เลยนะครับ
ขอบคุณที่รับชม!
Thanks for watching

- พฤษภาคม 12, 2568
- 0 Comments
ภาพขายดีประจำเดือนเมษายน 2568
ผ่านไตรมาสแรกของปีไปแล้ว ผลประกอบการเป็นยังไงกันบ้างตอนนี้คงกระทบกับการมาของ AI จริงๆ หละ แต่ผลกระทบก็มี 2 แบบ แบบเชิงบวก กับ เชิงลบ ถ้าเราติดตามการขยับของเทคโนโลยี AI มาตลอด เราจะเท่าทันและเติบโตไปกับเขาได้ หวังว่าเพื่อนๆ ทุกคนจะใช้ประโยชน์จากกการมาของ AI ได้เต็มที่นะครับ
เกริ่นพอแล้ว เราไปดู 10 ภาพสต็อกขายดีของเดือนเมษายนที่ผ่านมากัน
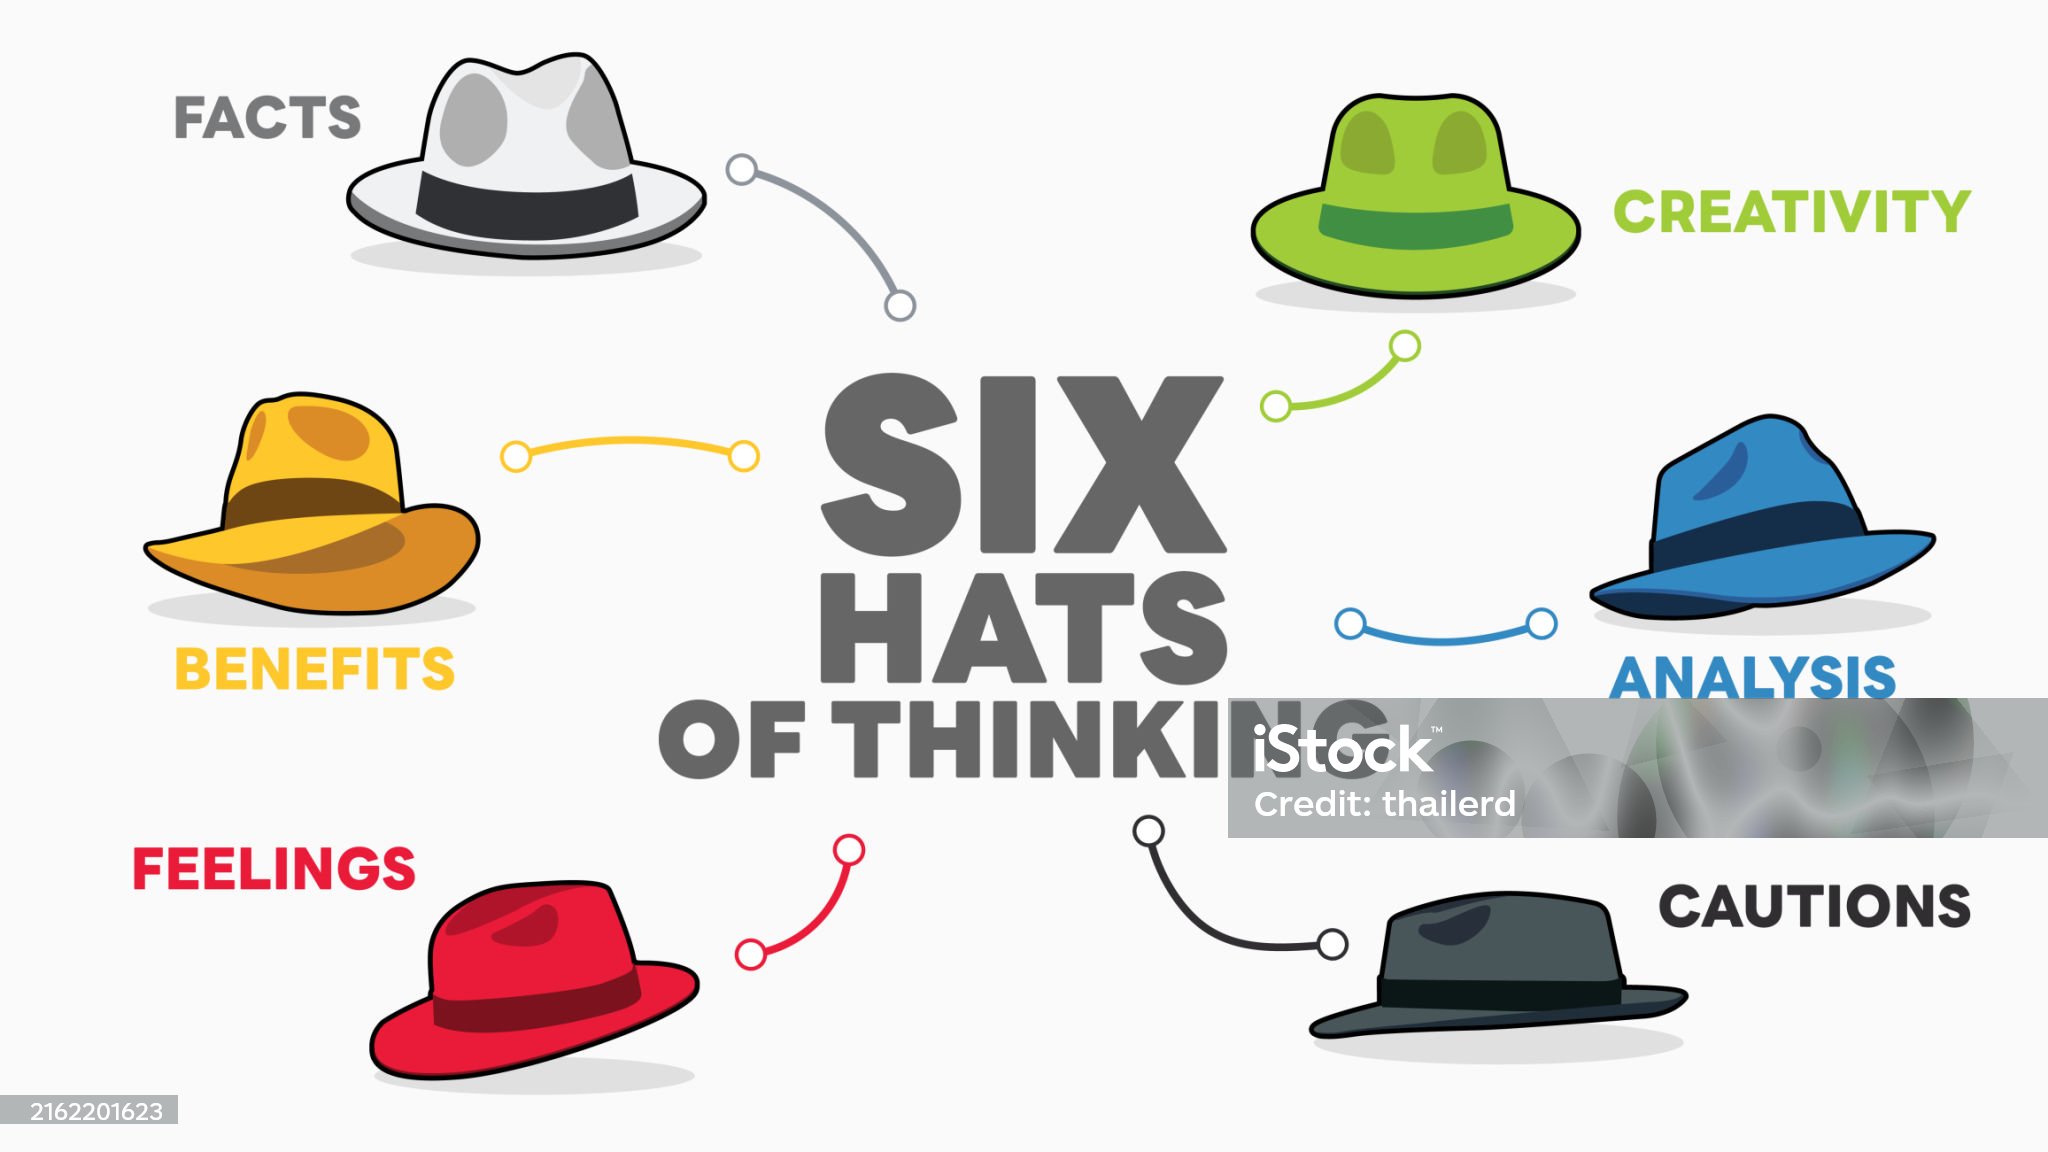
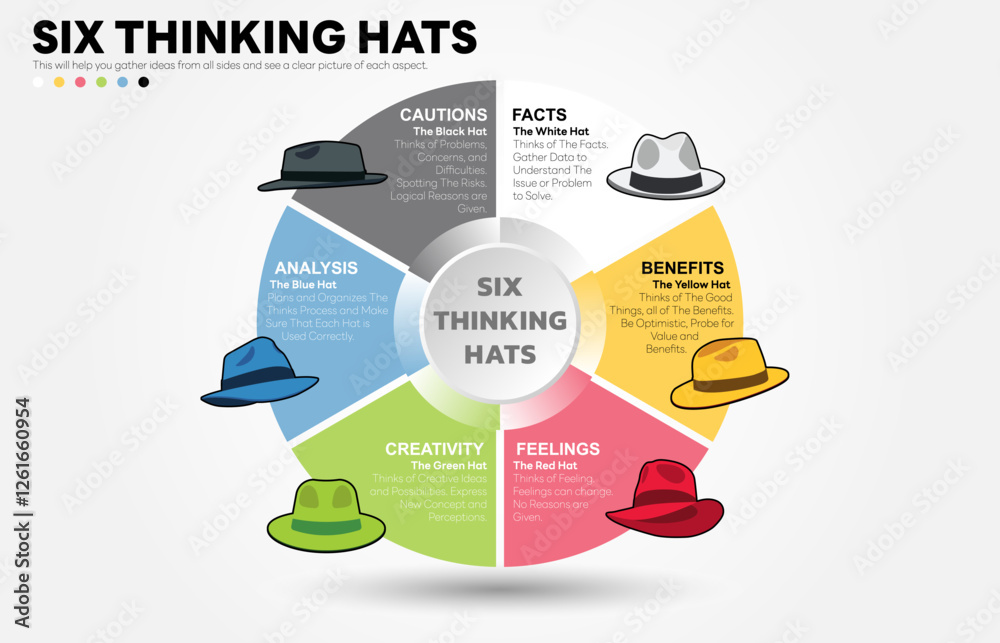
1. Illustration of Six Thinking Hats. Six Thinking Hats is Problem Solving Technique. The picture has 6 colorful hats. Each Represents Facts, Benefits, Feeling, Creativity, Analysis, Cautions. Vector illustration. All in a single layer. Elements for design.
2. Sale tags set vector badges template, up to 10, 20, 30, 40, 50, 60, 70, 80, 90 percent off, vector illustration isolated on white background. Price off tag icon flat design collection set. Up to discount label with different sale percentage. All in a single layer. Elements for design.
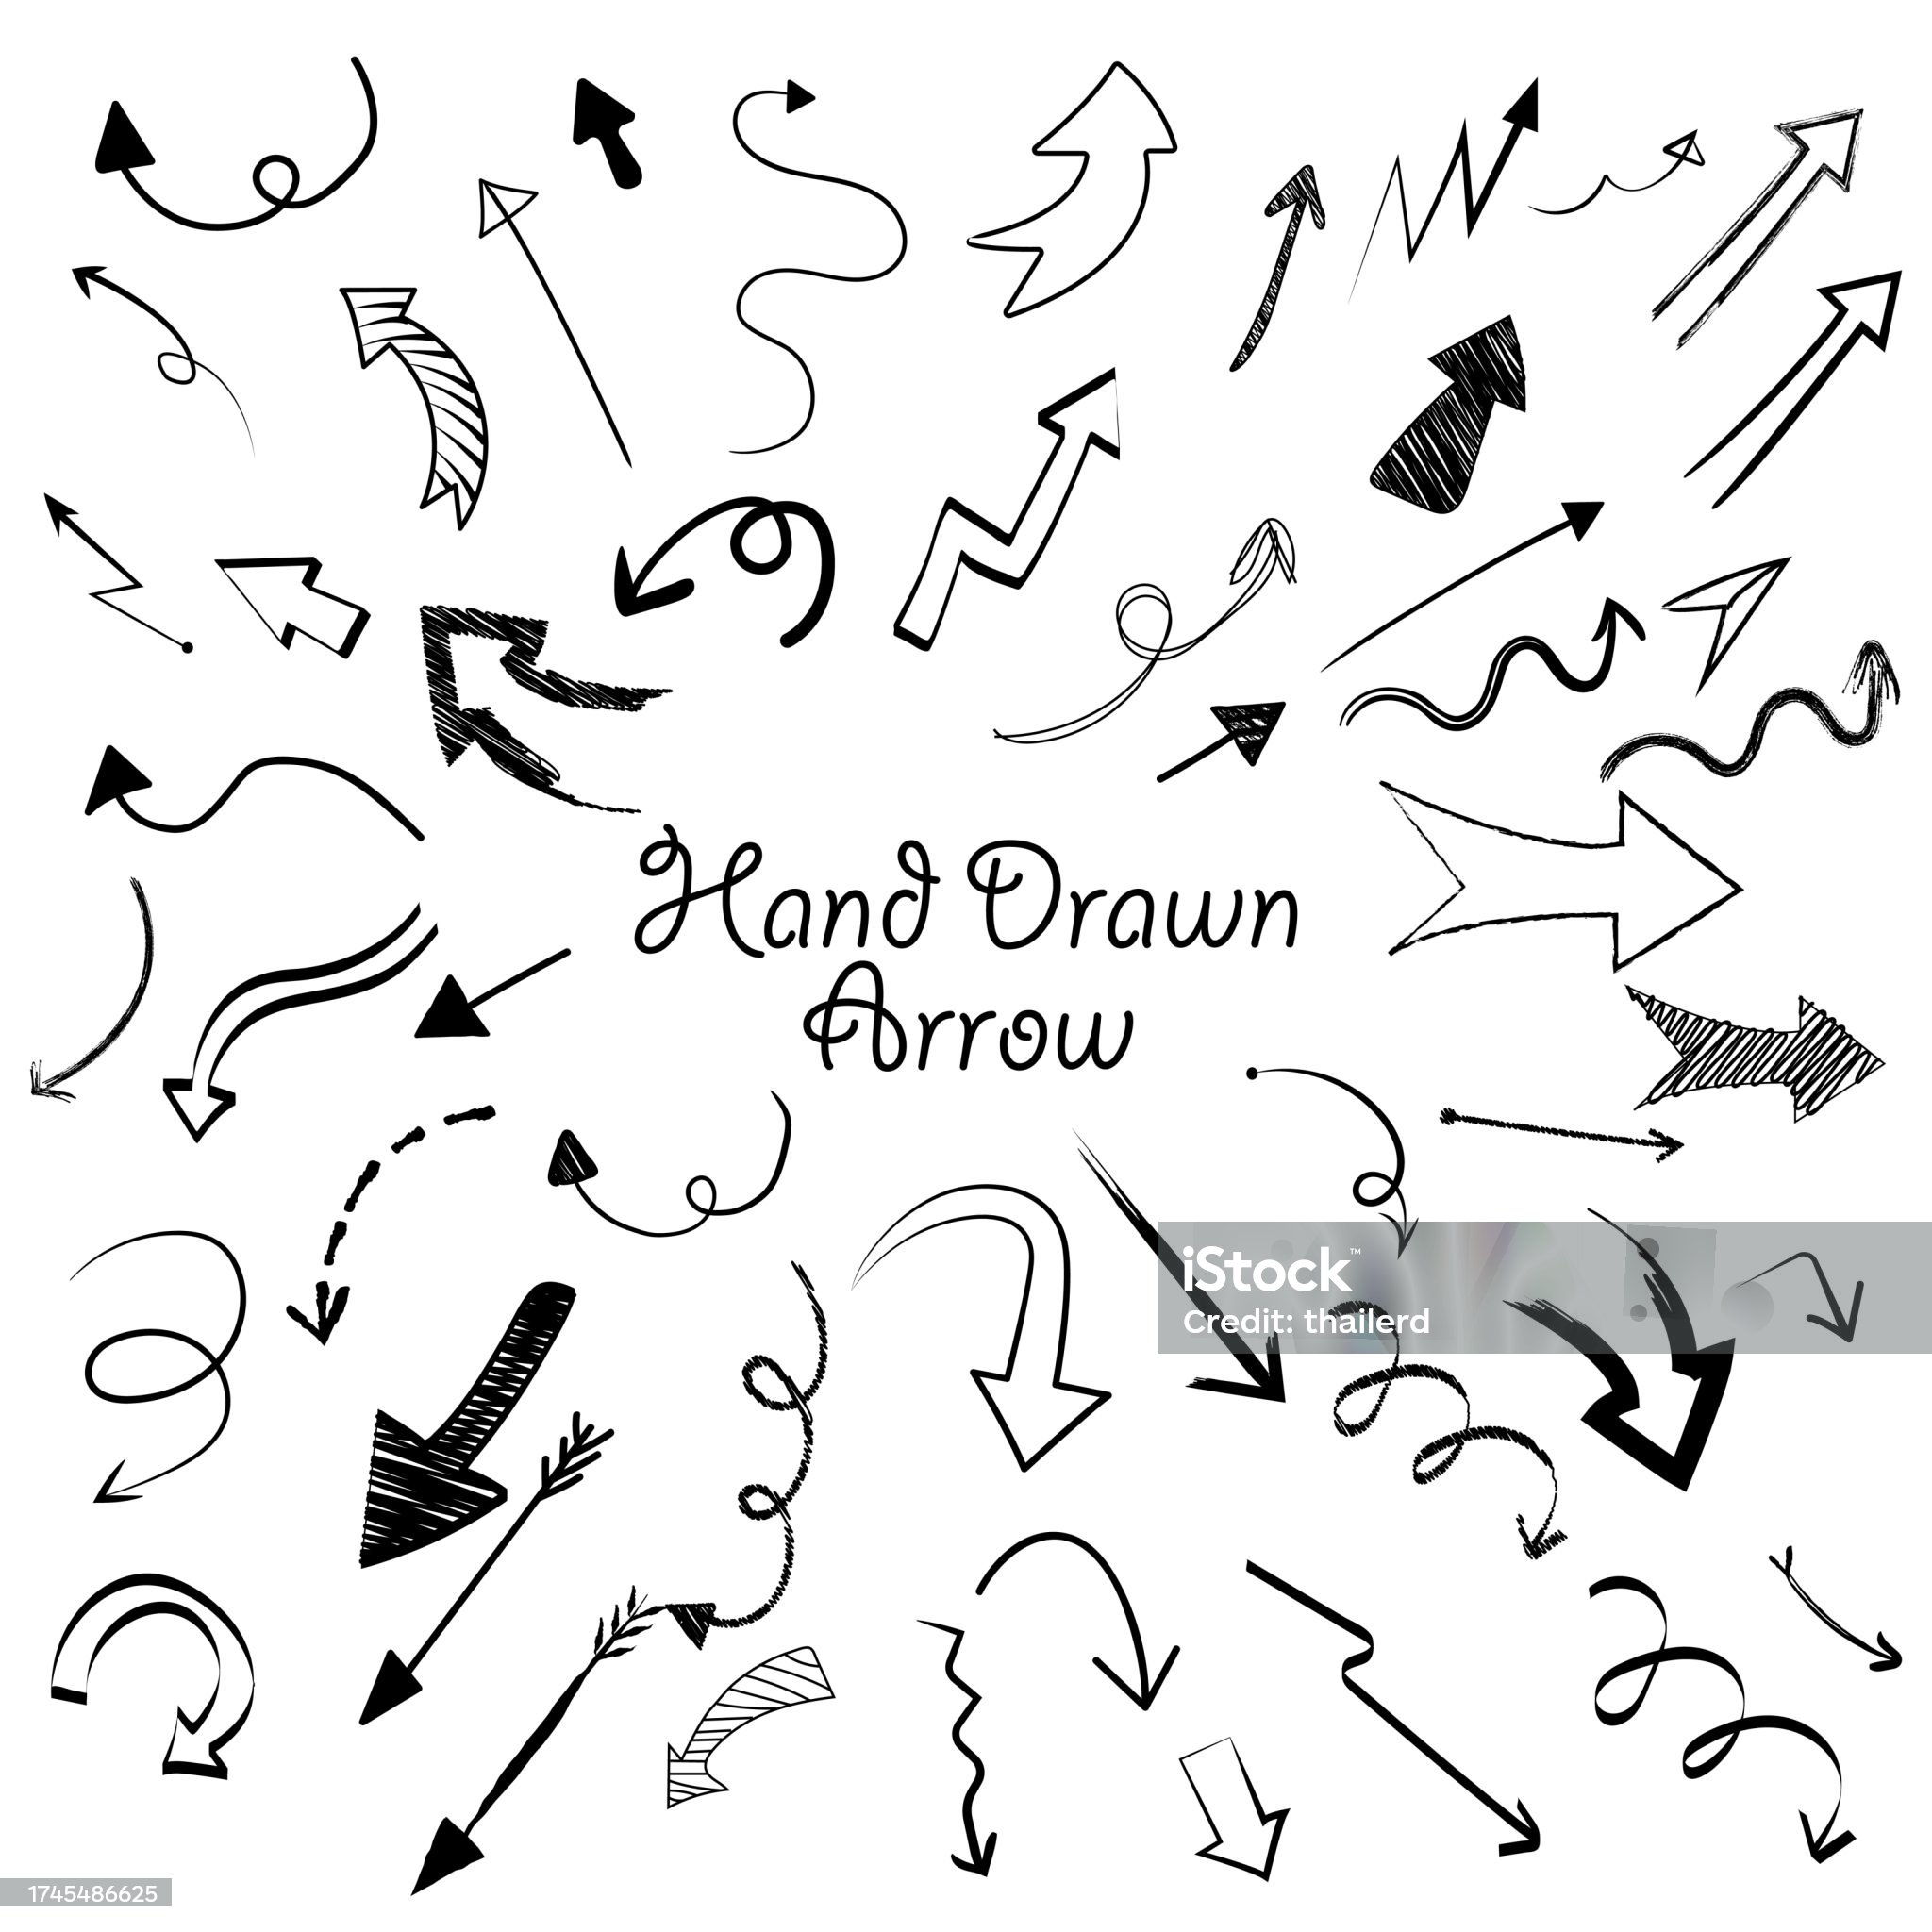
3. Set of Hand Drawn Arrow Vector. Hand Drawn Arrow Illustration. Hand Drawn Arrow Isolated on White Background. Vector illustration. All in a single layer. Elements for design.
4. Sale tags set vector badges template, up to 10, 20, 30, 40, 50, 60, 70, 90, 80 percent off, vector illustration isolated on white background. Price off tag icon flat design collection set. Up to discount label with different sale percentage. Vector illustration. All in a single layer. Elements for design.
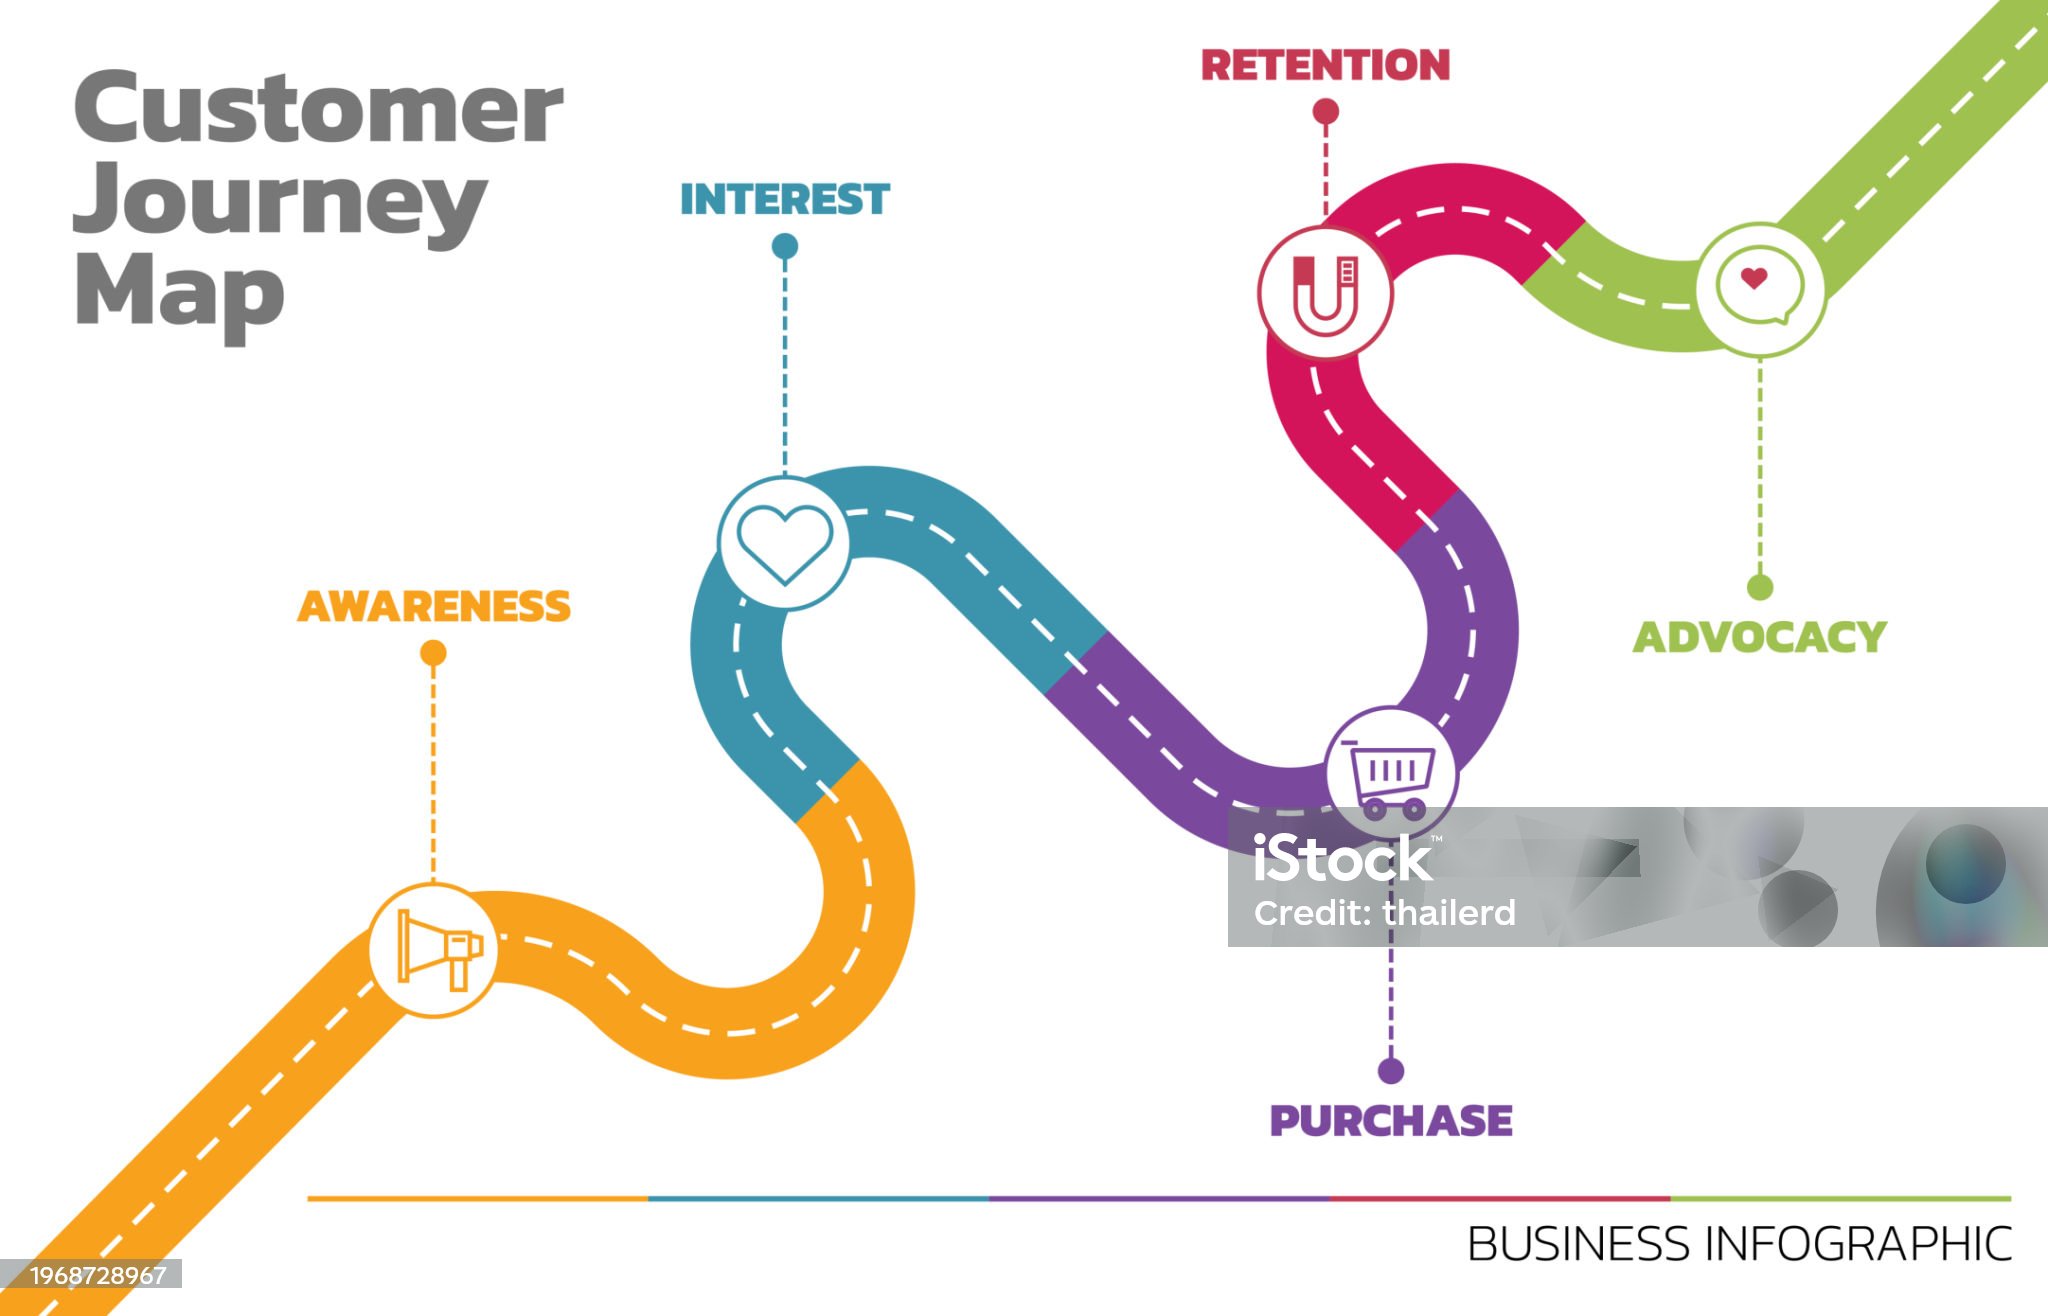
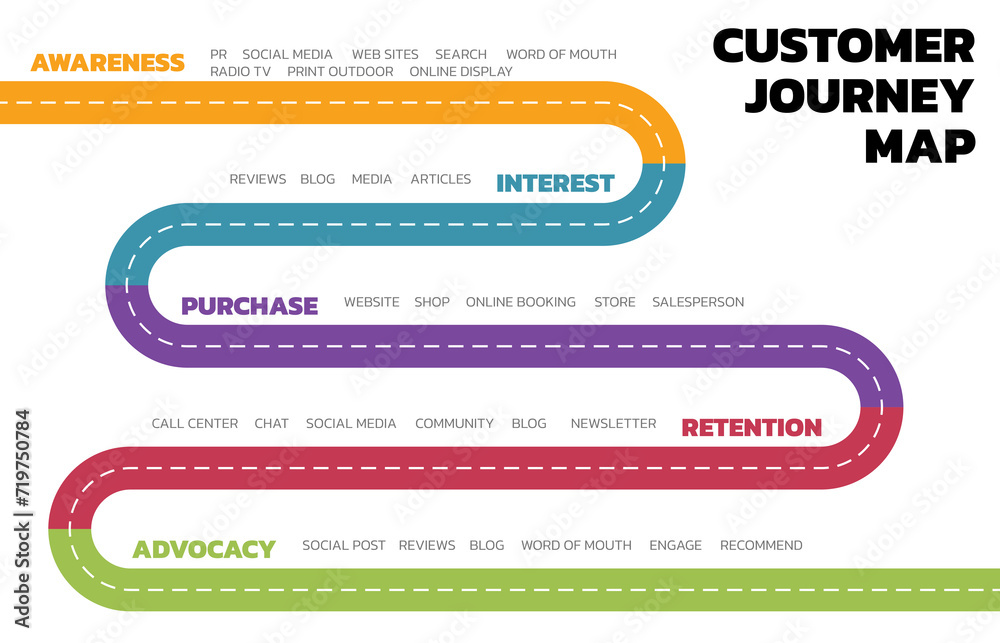
5. Illustration of Customer Journey Map. Customer Journey Map Showing Steps of Customers Buying Process. Vector Illustration. All in a single layer. Elements for design.
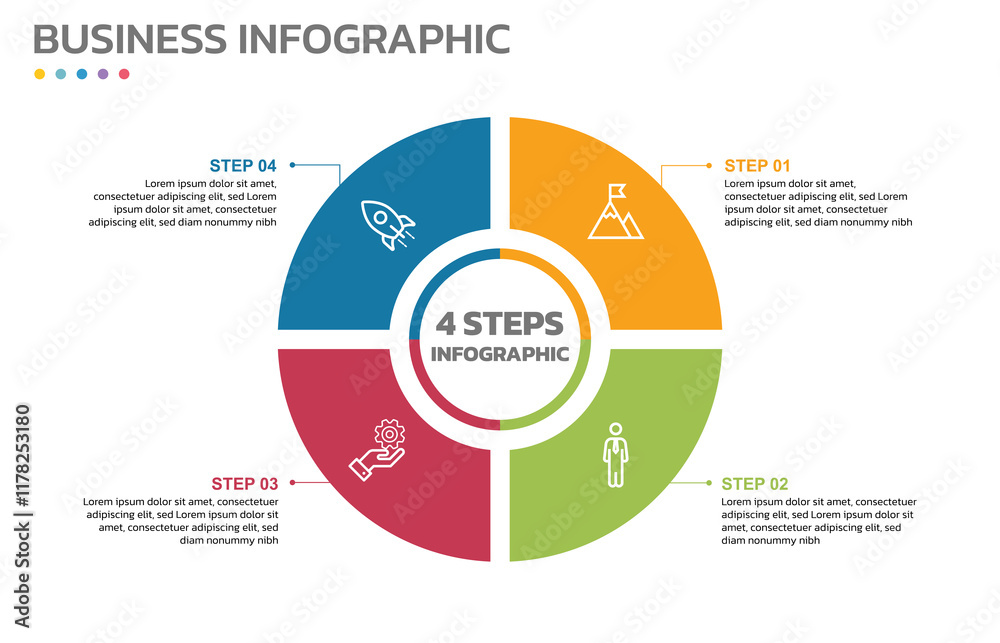
6. Visual data presentation. Cycle diagram with 4 options. Pie Chart Circle infographic template with 4 steps, options, parts, segments. Business concept. Editable pie chart with sectors. Vector Illustration. All in a single layer. Elements for design.
7. Illustration of Customer Journey Map. Customer Journey Map Showing Steps of Customers Buying Process. Vector Illustration. All in a single layer. Elements for design.
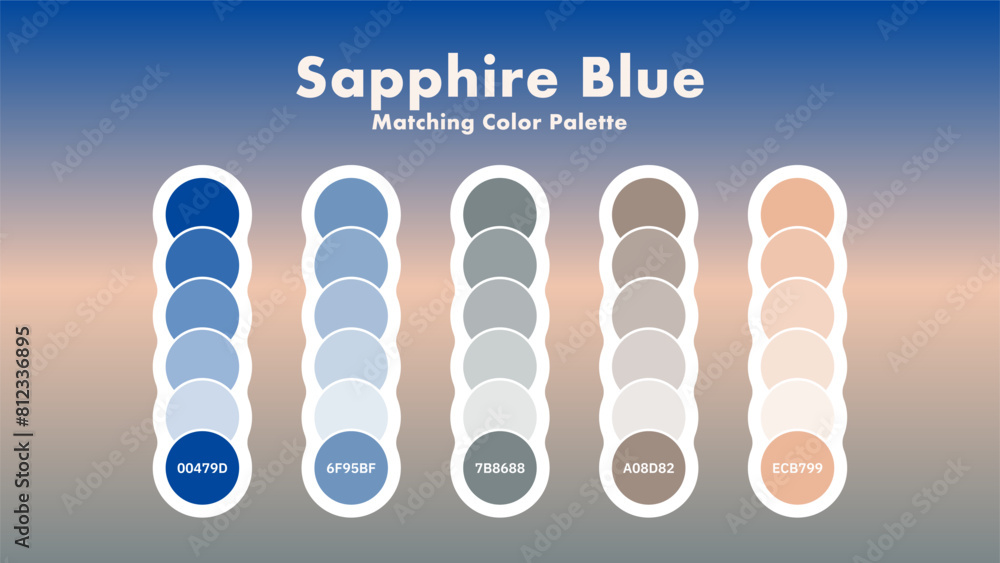
8. Set of Sapphire Blue Color Palette Combination in RGB Hex. Matching color palette guide swatch catalog collection with RGB HEX color combinations. Sapphire blue is a rich and vibrant color that can be
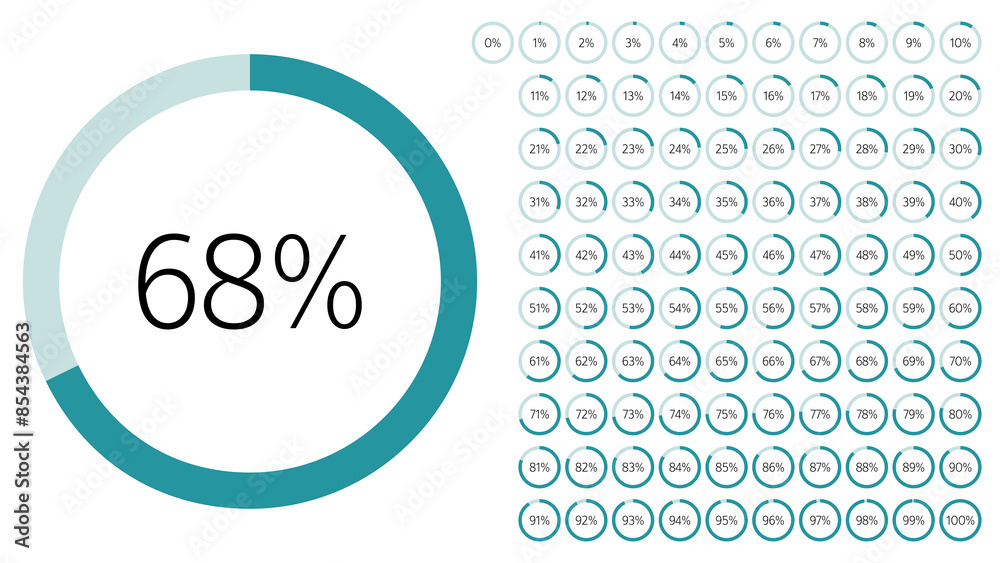
9. Set of circle percentage diagrams from 0 to 100 for Web Design, User Interface UI UX or Infographic. Loading indicator Colorful Progress from Blue to Dark Blue on White Background. Circle icons set. Vector Illustration. All in a single layer. Elements for design.
10. Illustration of Six Thinking Hats. Six Thinking Hats is Problem Solving Technique. The picture has 6 colorful hats. Each Represents Facts, Benefits, Feeling, Creativity, Analysis, Cautions. Vector illustration. All in a single layer. Elements for design.
ภาพขายดีประจำเดือนเมษายน 2568
ภาพขายดีประจำเดือนที่ผ่านมา
- พฤษภาคม 05, 2568
- 0 Comments
