Best Image Sold in February 2025
มีนาคม 09, 2568ภาพขายดีประจำเดือนกุมภาพันธ์ 2568
เดือนที่ 2 เดือนแห่งความรัก ภาพหวานๆ ก็ต้องเข้ามาเดือนแห่งความรัก ขอให้ทุกท่านที่อ่าน BLOG นี้ มีความรักที่ดีทุกๆ ท่าน
เกริ่นพอแล้ว เราไปดู 10 ภาพสต็อกขายดีของเดือนกุมภาพันธ์ที่ผ่านมากัน
1. Happy Valentine's day greeting card in paper cut style. Two origami pink paper balloon heart shape flying on the sky over the cloud. Vector illustration. All in a single layer.
2. Set Blank Red Bucket Hat Vector For Template. Red Fisherman Hat. Red Bucket Hat Technical Fashion Illustration. Red Bucket Hat Isolated on White Background. Vector Illustration. All in a single layer. Elements for design.
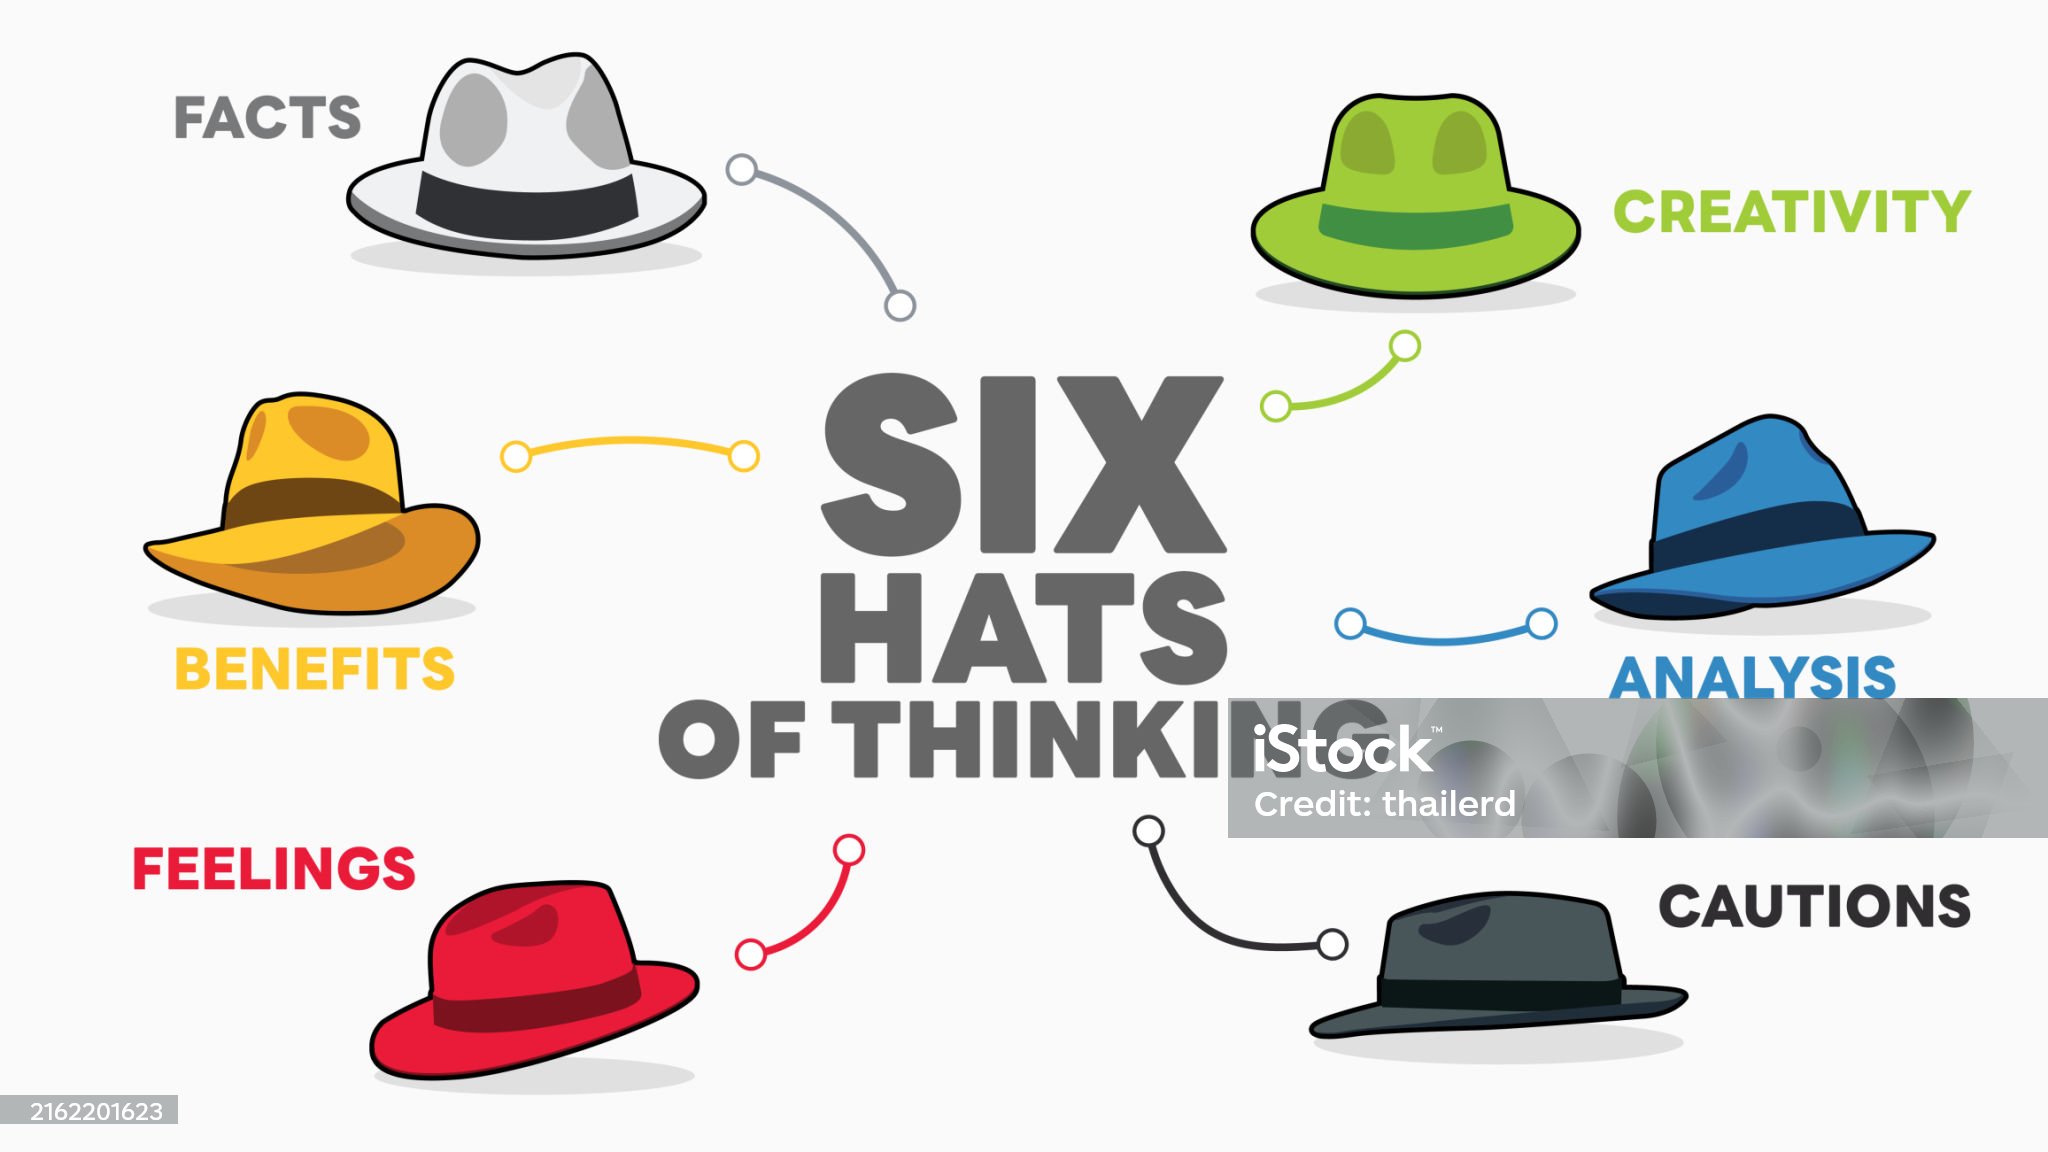
3. Illustration of Six Thinking Hats. Six Thinking Hats is Problem Solving Technique. The picture has 6 colorful hats. Each Represents Facts, Benefits, Feeling, Creativity, Analysis, Cautions. Vector illustration. All in a single layer.
4. Sale tags set vector badges template, up to 10, 20, 30, 40, 50, 60, 70, 90, 80 percent off, vector illustration isolated on white background. Price off tag icon flat design collection set. Up to discount label with different sale percentage.Vector Illustration. All in a single layer.
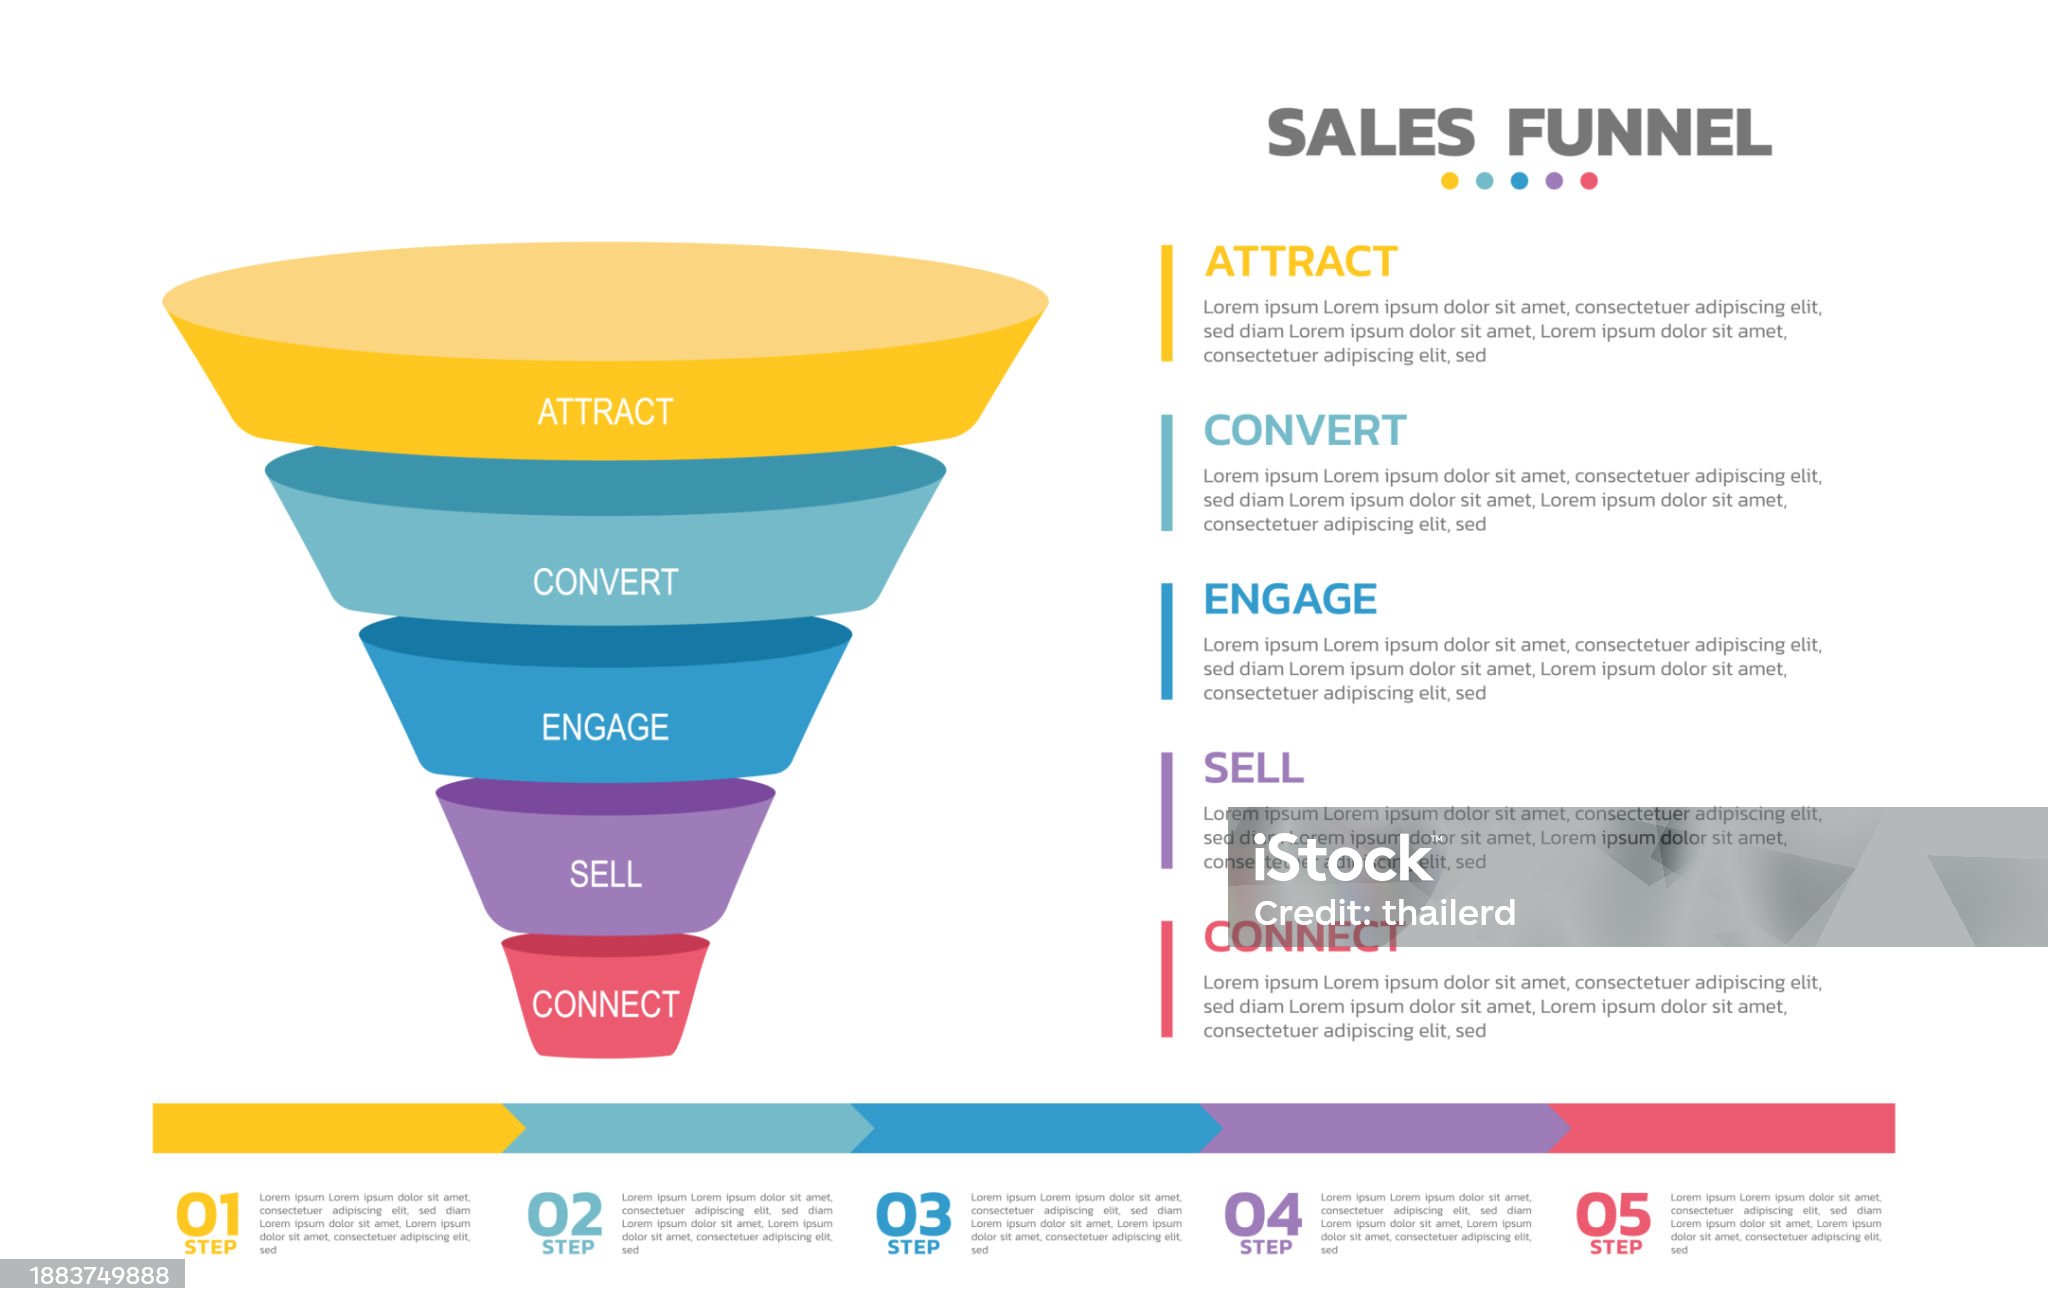
5. Infographic Sales funnel. Sales funnel is a representation of the stages that a prospective new customer. 5 Level Modern Sales funnel diagram. Vector illustration. All in a single layer.
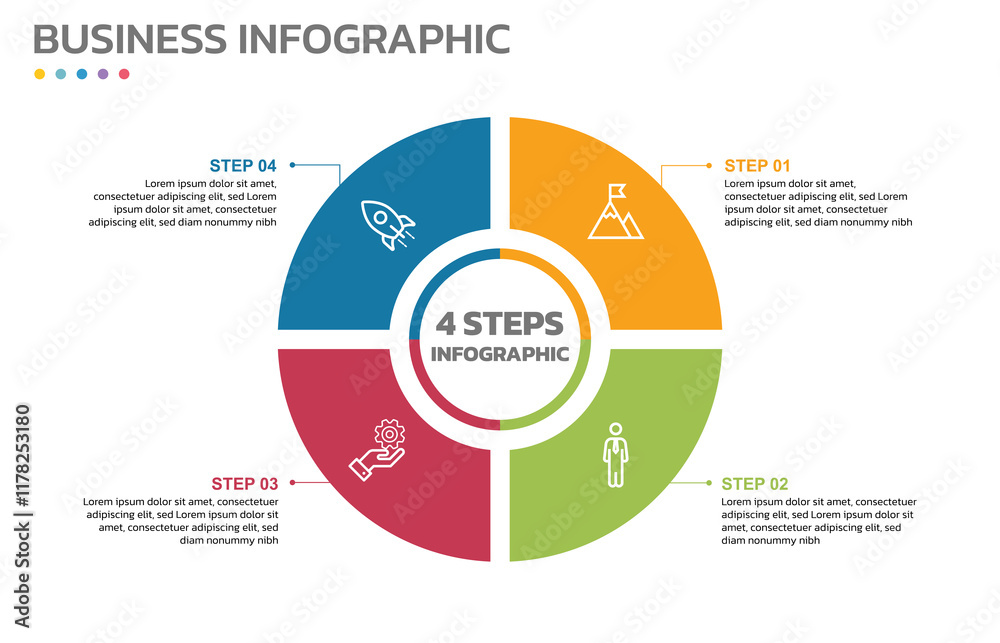
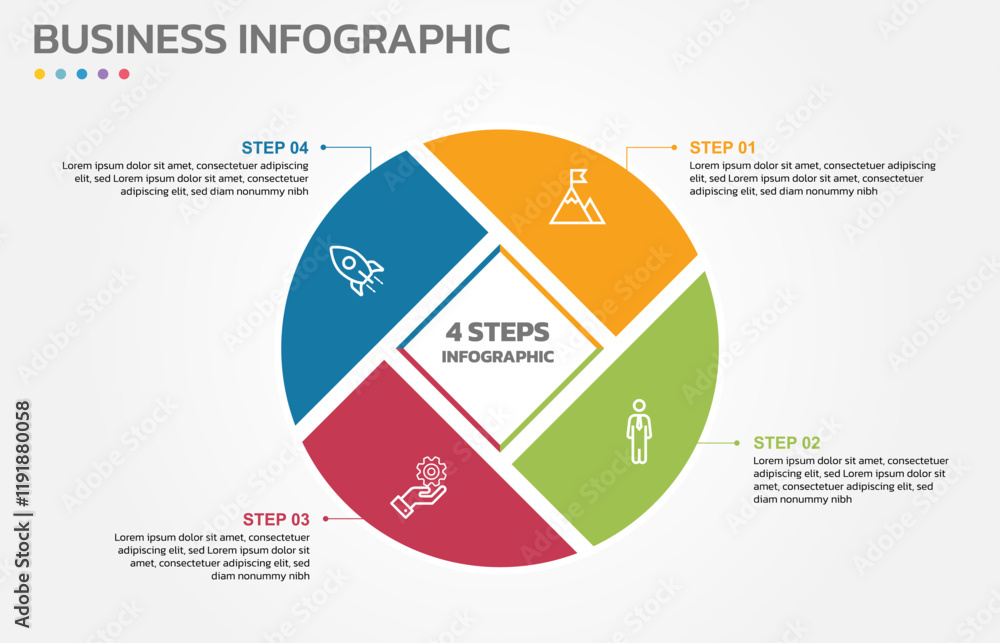
6. Visual data presentation. Cycle diagram with 4 options. Pie Chart Circle infographic template with 4 steps, options, parts, segments. Business concept. Editable pie chart with sectors. Vector Illustration. All in a single layer. Elements for design.
7. Visual data presentation. Cycle diagram with 4 options. Pie Chart Circle infographic template with 4 steps, options, parts, segments. Business concept. Editable pie chart with sectors. Vector Illustration. Elements for design.
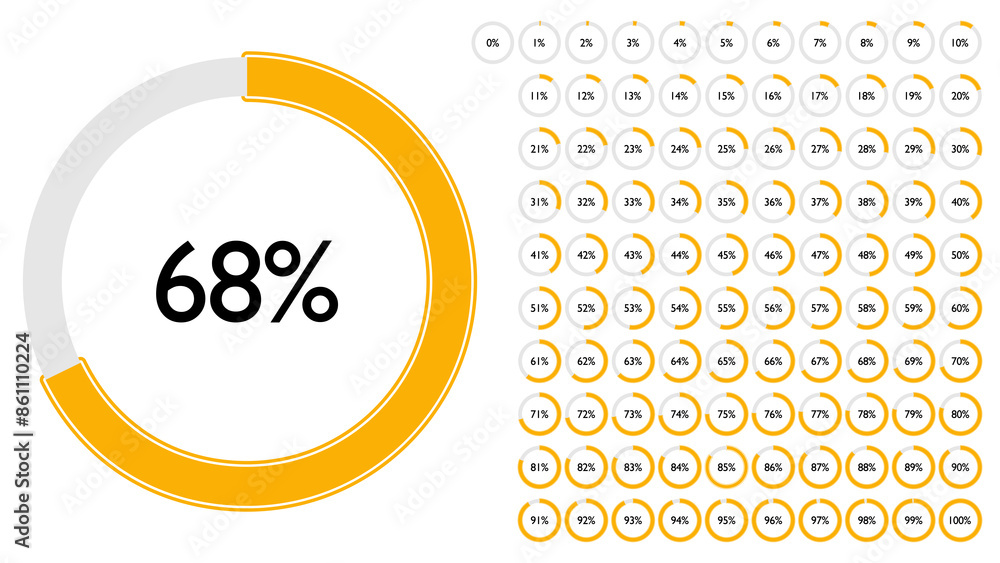
8. Set of circle percentage diagrams from 0 to 100 for Web Design, User Interface UI UX or Infographic. Loading indicator Colorful Progress Yellow on White Background. Vector illustration. Icons set. Elements for design. All in a single layer.
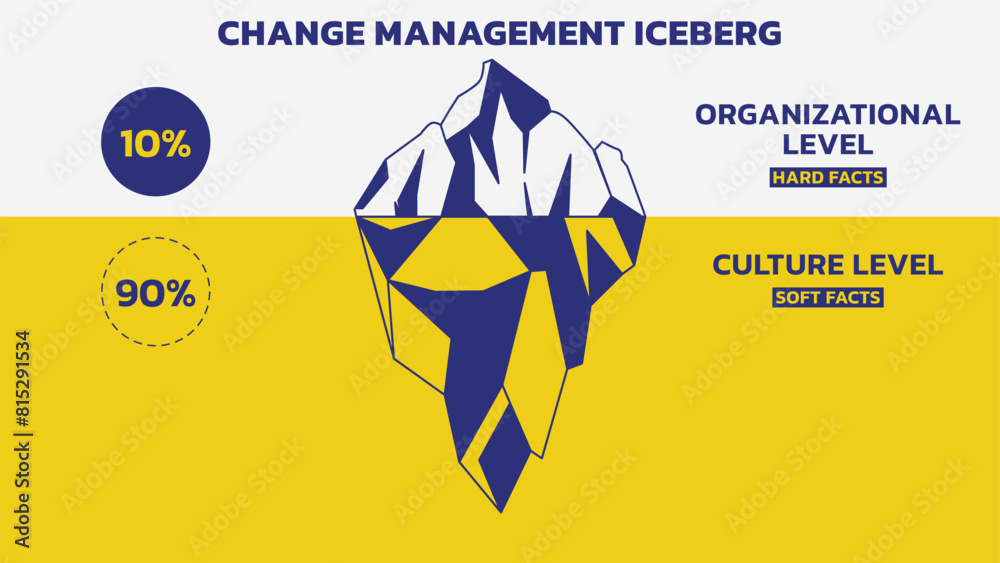
9. Iceberg diagram, vector illustration outline style. Change Management Iceberg Model explains that we often focus on three factors of change: cost, quality, and time. These are only 10% of change. Vector illustration. All in a single layer. Elements for design.
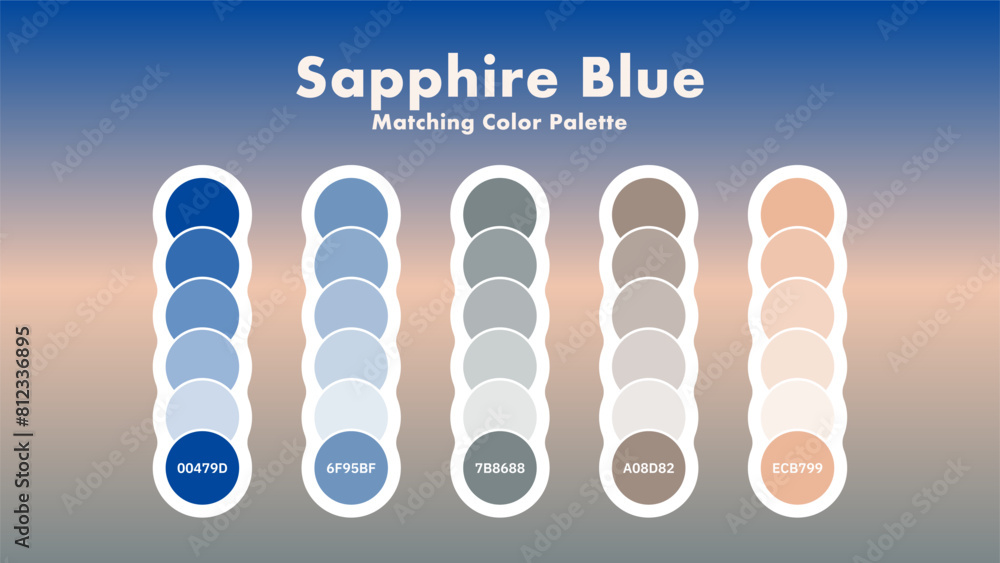
10. Set of Sapphire Blue Color Palette Combination in RGB Hex. Matching color palette guide swatch catalog collection with RGB HEX color combinations. Sapphire blue is a rich and vibrant color that can be. Vector illustration. All in a single layer. Elements for design.
ภาพขายดีประจำเดือนกุมภาพันธ์ 2568






0 comments